Navigating the world of stock market analysis can often feel like deciphering a complex code. Investors, both seasoned and novice, seek ways to understand market trends, identify opportunities, and minimize risks. With countless variables at play, from economic indicators to investor sentiment, grasping the intricacies of stock movements is both an art and a science.
At the heart of effective stock market analysis lies the understanding of patterns and insights that can guide investment decisions. By breaking down the components that drive stock prices—such as company performance, market conditions, and macroeconomic factors—investors can develop a clearer picture of potential returns. This article will delve deep into the essential techniques and strategies used in stock market analysis, empowering readers to make informed financial choices in the ever-evolving landscape of Wall Street.
Fundamentals of Stock Market Analysis
Stock market analysis is the process of evaluating securities to make informed investment decisions. Analysts typically use a variety of methods to assess a company’s financial health, industry position, and market trends. By examining factors such as earnings, revenue growth, and debt levels, investors can gauge the potential for a stock’s future performance. Different approaches to stock market analysis can lead to varying conclusions, making it essential for investors to familiarize themselves with the various methodologies available.
One key aspect of stock market analysis is fundamental analysis, which focuses on a company’s intrinsic value by scrutinizing financial statements and related data. Analysts look at income statements, balance sheets, and cash flow statements to determine a company’s profitability, liquidity, and solvency. This approach enables investors to identify undervalued or overvalued stocks based on their assessments of the company’s financial metrics and future growth prospects.
Analysis Today
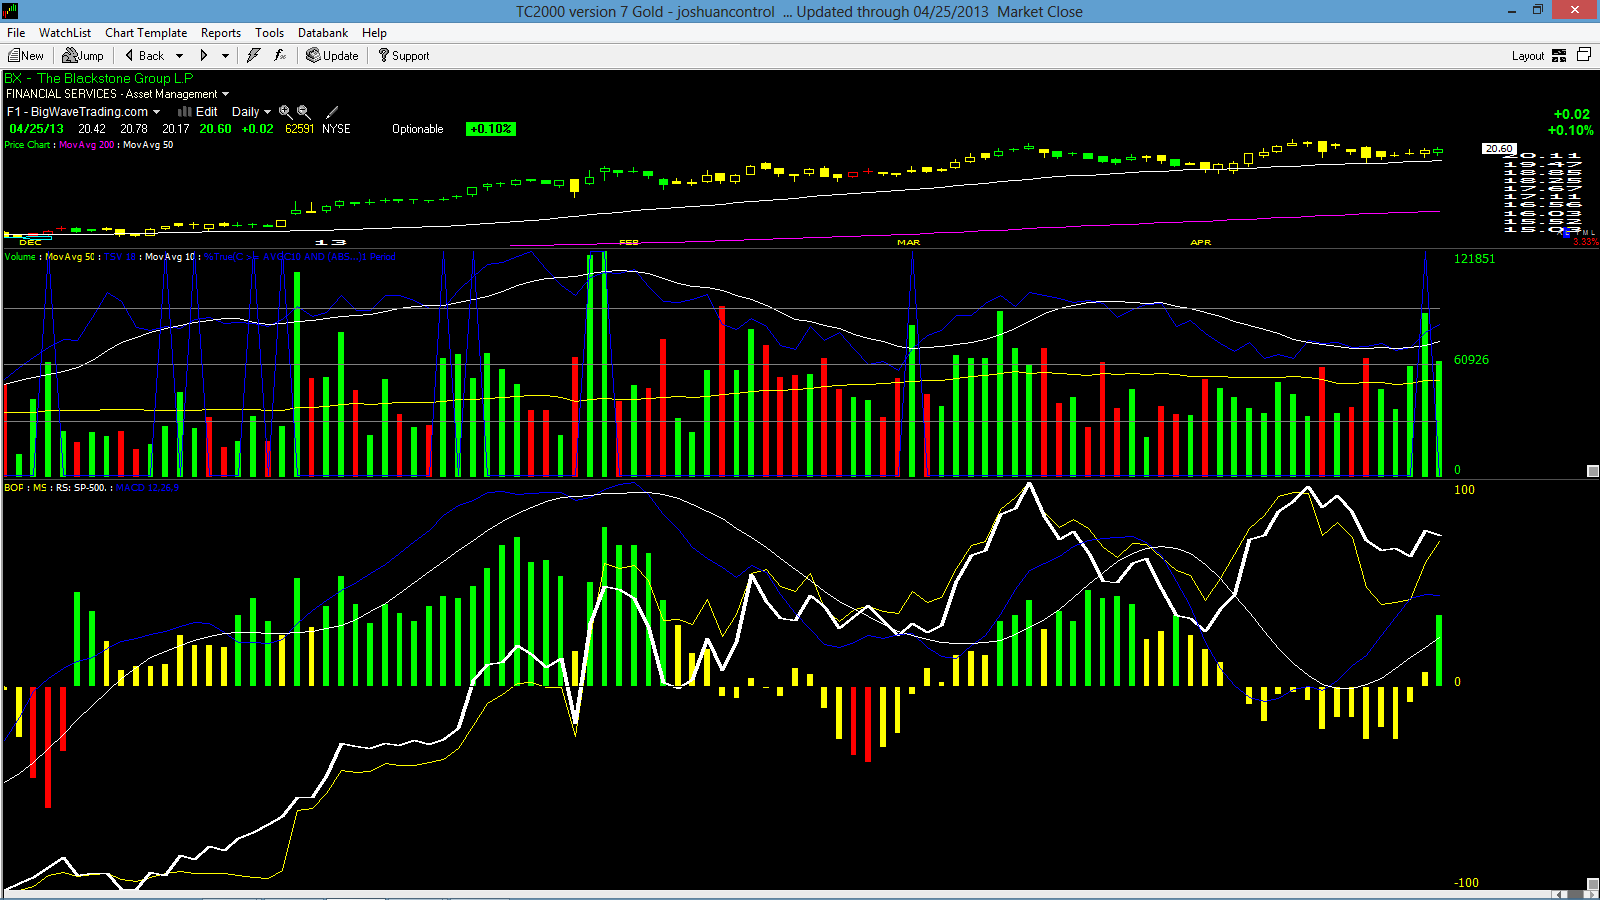
Another important method is technical analysis, which examines historical price movements and trading volume to forecast future price changes. By utilizing charts and various indicators, technical analysts aim to predict market trends based on patterns. This approach can be particularly useful for short-term trading strategies, allowing investors to make quick decisions based on market momentum and investor sentiment. Understanding both fundamental and technical analysis is essential for anyone looking to navigate the complexities of the stock market.
Technical Analysis Techniques
Technical analysis involves the study of price movements and trading volumes to forecast future price behavior. Among the fundamental techniques employed in technical analysis is the use of trend lines. These lines are drawn on a price chart to identify the direction of the market, whether it is trending upward, downward, or sideways. By connecting key price highs or lows, traders can visually discern patterns that may suggest future movements, thereby aiding them in making informed decisions.
Another essential technique is the utilization of moving averages. Moving averages smooth out price data to create a trend-following indicator that helps to identify the direction of the trend. The two common types are the simple moving average and the exponential moving average, each with its specific applications. Traders often look for crossovers between short-term and long-term moving averages as potential buy or sell signals, reinforcing the likelihood of a trend continuation or reversal.
Indicators such as the Relative Strength Index (RSI) and Moving Average Convergence Divergence (MACD) also play a significant role in technical analysis. The RSI measures the speed and change of price movements, providing insight into overbought or oversold conditions. On the other hand, the MACD is a trend-following momentum indicator that illustrates the relationship between two moving averages. Both of these indicators, when combined with other techniques, can enhance the analysis and give traders valuable insights into potential trading opportunities within the stock market.
Analyzing Market Trends
Understanding market trends is crucial for anyone engaged in stock market analysis. Trends typically reveal the prevailing direction in which stock prices move over a period of time. This can be upward, downward, or sideways. Identifying these patterns allows investors to make informed decisions, helping them to enter or exit trades at optimal times. By analyzing historical price movements and chart patterns, traders can gain insights into potential future performance.
Technical analysis is a common approach used for tracking market trends. It involves the use of charts and indicators to evaluate price movements and trading volume. Tools such as moving averages, trend lines, and relative strength index help analysts discern whether a stock is trending positively or negatively. By recognizing momentum shifts early, investors can capitalize on market movements before they become widely recognized.
Fundamental analysis is equally important in the context of market trends. It involves evaluating a company’s financial health, including earnings reports, revenue growth, and market conditions. By assessing a company’s fundamentals alongside technical trends, investors can gain a more comprehensive understanding of the market environment. This dual approach enhances the accuracy of predictions and provides a solid foundation for investment strategies.
Economic Indicators and their Impact
Economic indicators play a crucial role in stock market analysis as they provide valuable insights into the economic health of a country. These indicators include metrics such as gross domestic product, unemployment rates, inflation, and consumer confidence. Investors closely monitor these indicators since they can significantly influence market trends and investor sentiment. A growing economy typically signals robust corporate earnings and can lead to bullish market conditions, while contraction can hint at potential downturns.
Inflation, one of the key economic indicators, affects purchasing power and can impact interest rates. When inflation rises, central banks often respond by increasing interest rates to curb spending, which can have a cooling effect on the stock market. Investors often react to inflation data by adjusting their portfolios, moving funds toward sectors that may perform better in an inflationary environment. Staying informed about these trends is essential for traders looking to navigate the complexities of the stock market.
Consumer confidence is another important economic indicator influencing stock market analysis. High consumer confidence usually correlates with increased spending, which boosts corporate profits and can lead to higher stock prices. Conversely, low confidence may result in reduced spending and potentially lower profit margins for companies. Understanding these dynamics helps investors anticipate market movements and make informed decisions in their trading strategies.
Risk Management Strategies
Effective risk management is essential for successful stock market analysis. Investors must understand their risk tolerance and establish strategies that align with their financial goals. A commonly used approach is diversification, which involves spreading investments across various asset classes or sectors to reduce exposure to any single investment’s volatility. By allocating funds to different stocks, bonds, and other securities, investors can mitigate the potential impact of a downturn in any one area of their portfolio.
Another vital strategy is setting stop-loss orders. These are predetermined price levels at which an investor will sell a stock to prevent further losses. Implementing stop-loss orders helps limit potential losses and can provide peace of mind during periods of market fluctuations. Additionally, regularly reviewing and adjusting these orders based on market conditions can enhance their effectiveness, allowing investors to react promptly to changing circumstances.
Lastly, utilizing position sizing techniques can further bolster risk management efforts. This involves determining how much capital to allocate to a particular investment based on its risk level. By assessing the potential loss associated with each trade and adjusting the position size accordingly, investors can maintain control over their overall portfolio risk. Combining these strategies can create a robust framework for addressing market uncertainties, ensuring that stock market analysis remains focused on long-term success.


